Enterprise Dashboard 2024 ; revamped case study in 2025
FuelFlow
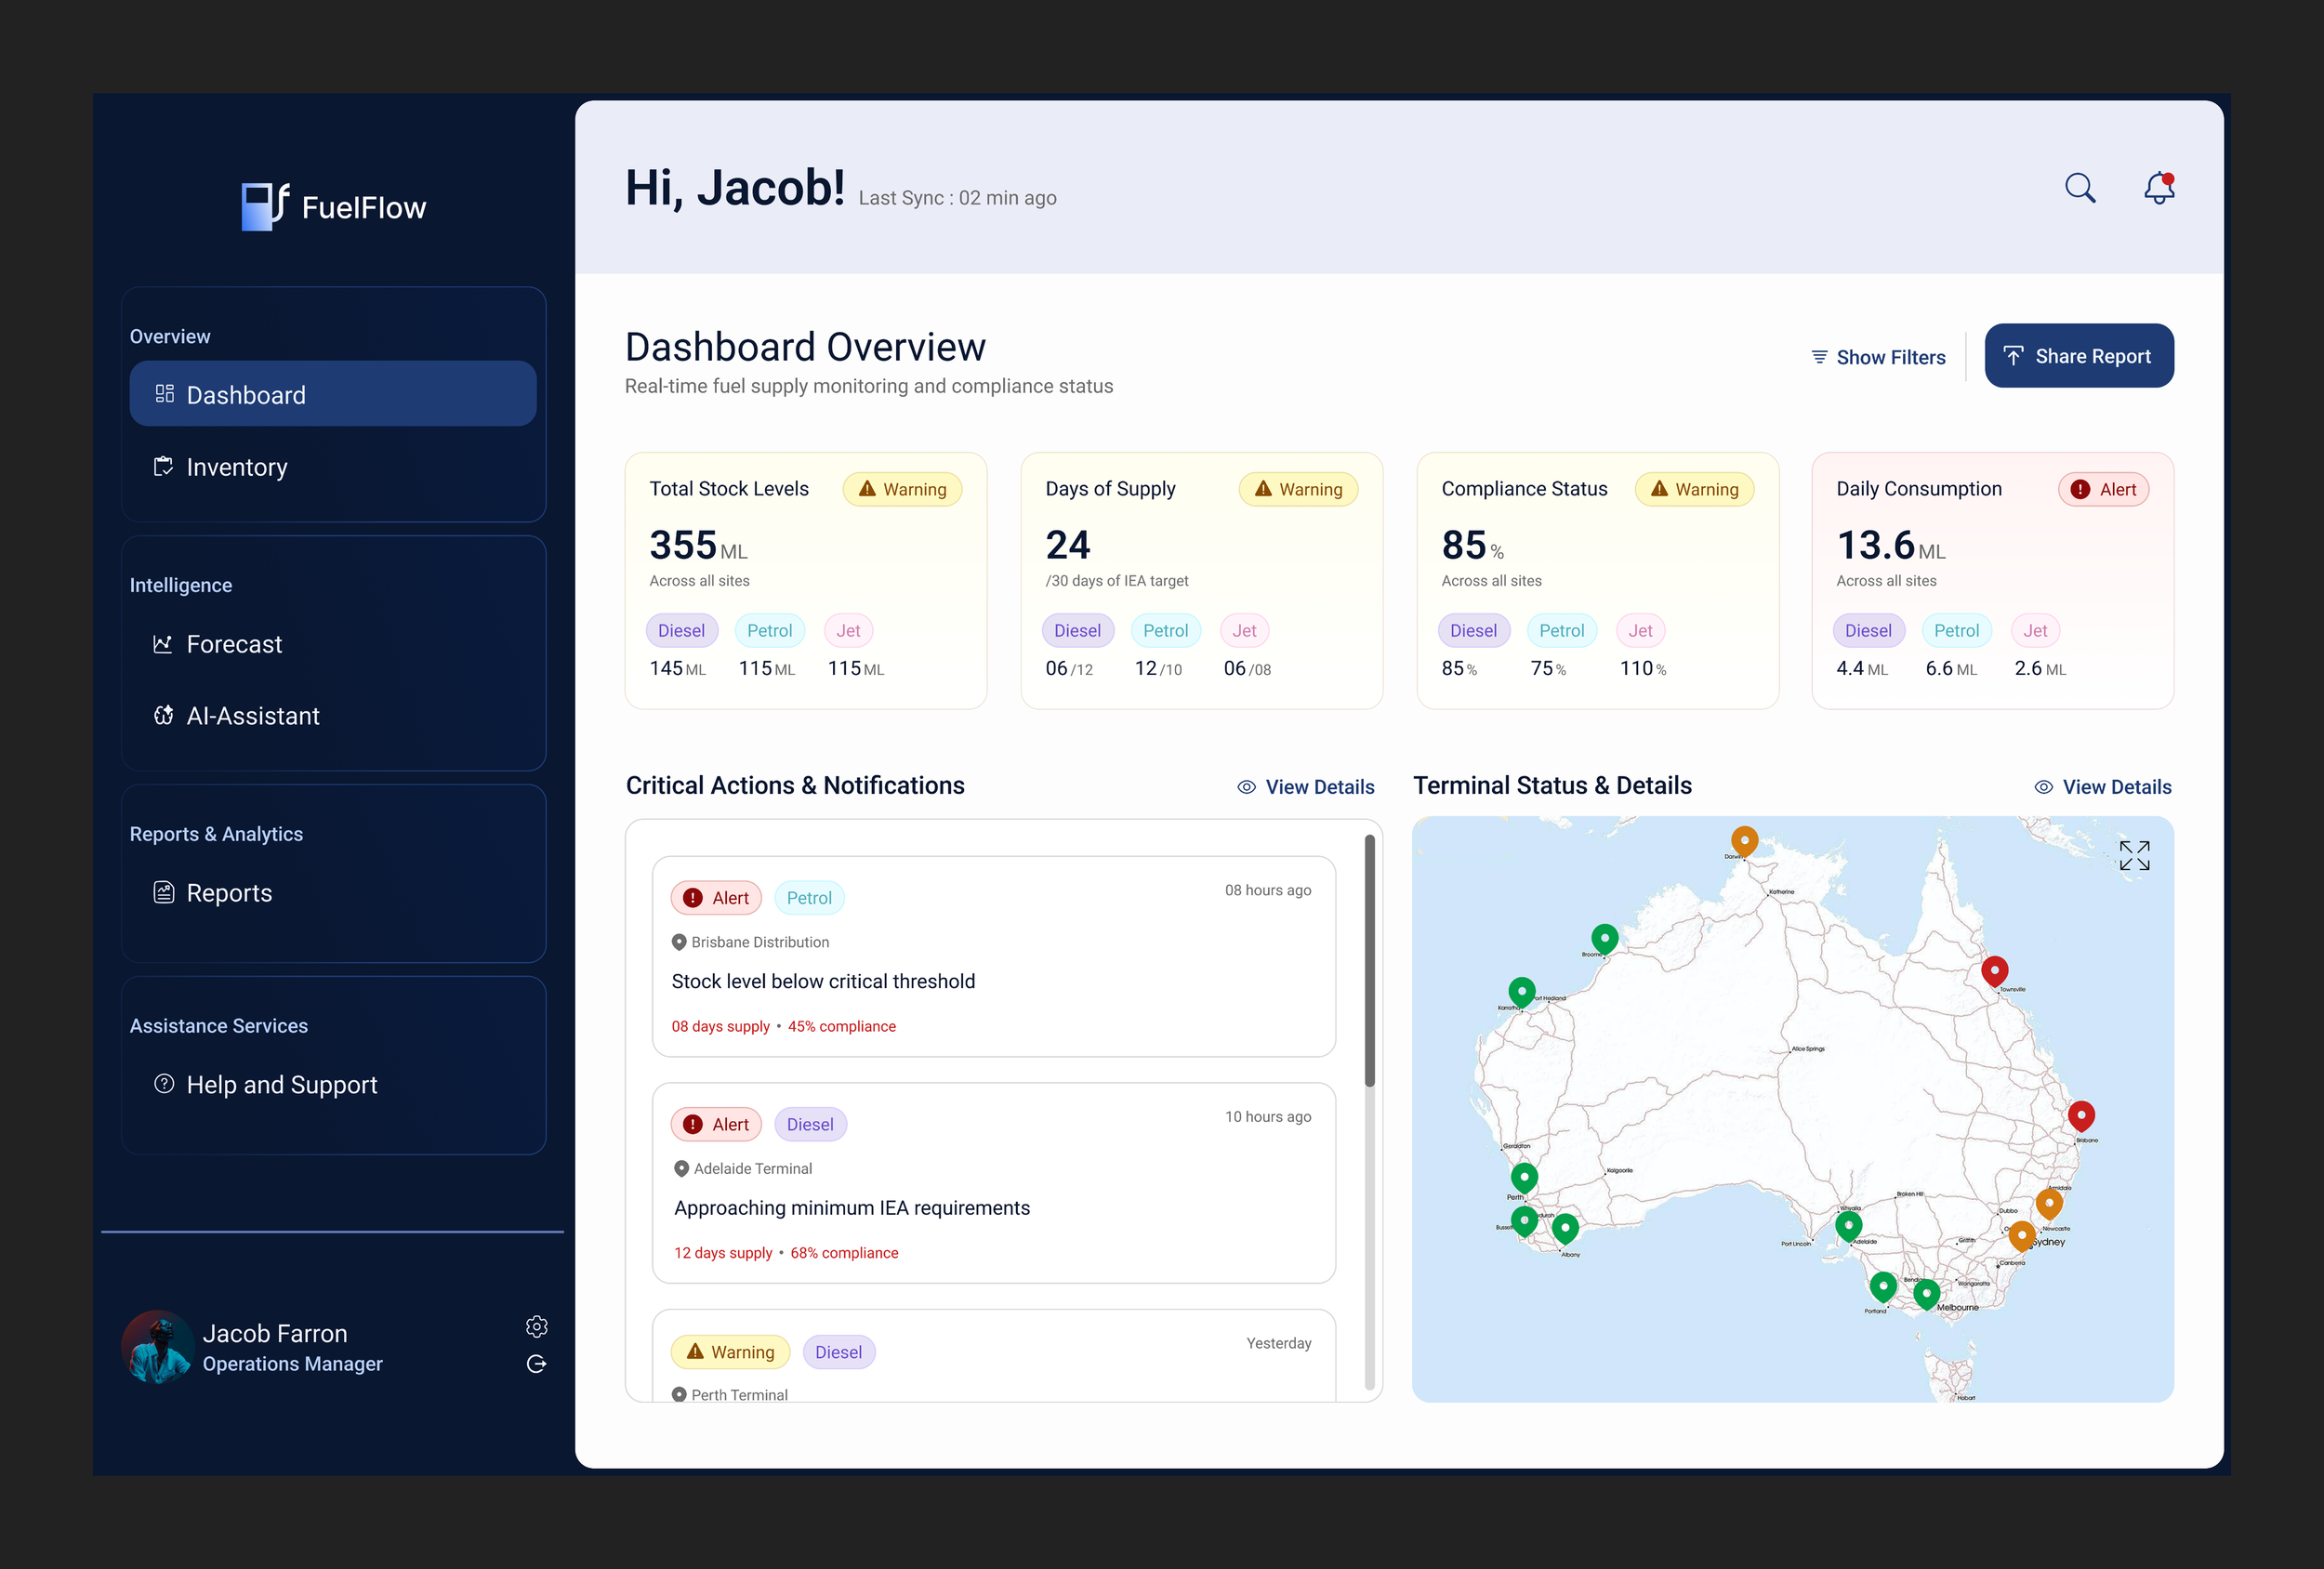
I helped a globally leading energy, oil & gas company design and develop an intelligent dashboard system with automation and AI-powered forecasting for national fuel demand compliance.
* This Case Study has been revamped and all data has been sanitized for confidentiality
My Role (Primary)
Design Strategy
Experience Designer
Individual Contributor (IC)
Brand’s Motive
Crafting Solution
How I contributed?
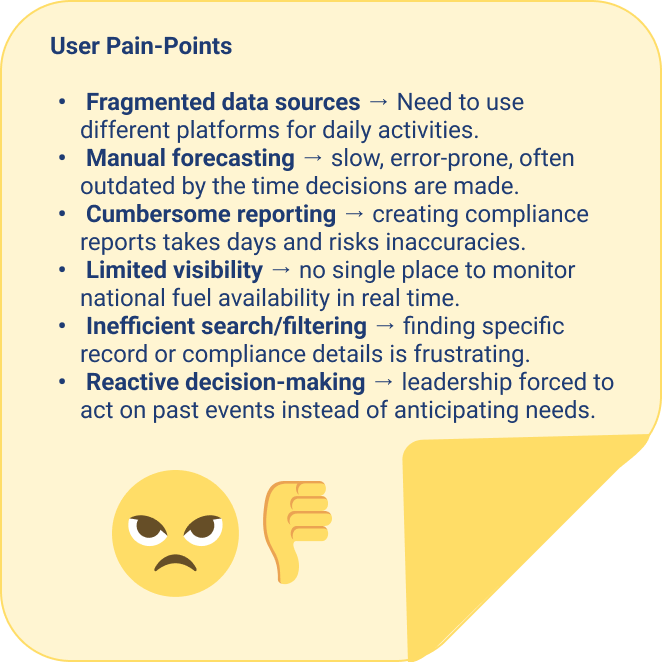
I began by engaging users through interviews and surveys to uncover their pain points, workflows, and expectations. In parallel, I facilitated stakeholder workshops to align on the product vision, target users, and success criteria. Collaborative sessions with engineers, product managers, and cross-functional teams helped surface technical considerations and define priorities, while a thorough evaluation of the existing system revealed gaps and opportunities for improvement.
Build and Design
Thank- you!

Prototyping, Testing & Iterations
Example :
Client & User Highlights
User Testimonials
Keep scrolling to see a quick snapshot of the Design Process, Client & User Highlights and Personal Learnings
Tools
Sketch
Zeplin
Miro, Mural, Azure, z-scaler
Team
Researcher, Service Designer
Engineers, BA, QA
Product Owner, Product Manager

I helped a globally leading energy, oil & gas company design and develop an intelligent dashboard system that ensures compliance with national fuel demand regulations. The solution provides real-time visibility across sectors, while integrating automation, AI-powered forecasting, and streamlined reporting to maintain a reliable and sufficient fuel supply at all times.

Challenge
During this project, I followed a detailed UX process, a glimpse of which is shown below
Research & Analysis
Other Details
The goal was to design a more efficient way to monitor and manage national fuel demand regulations. Critical data was scattered across multiple systems and manual reporting processes, making it difficult for teams to maintain real-time visibility across sectors and ensure timely compliance.
The challenge was to design a centralized system that could simplify complex operational data, enable accurate demand forecasting, and support faster, more reliable regulatory reporting—while remaining intuitive for teams managing large-scale fuel supply operations.
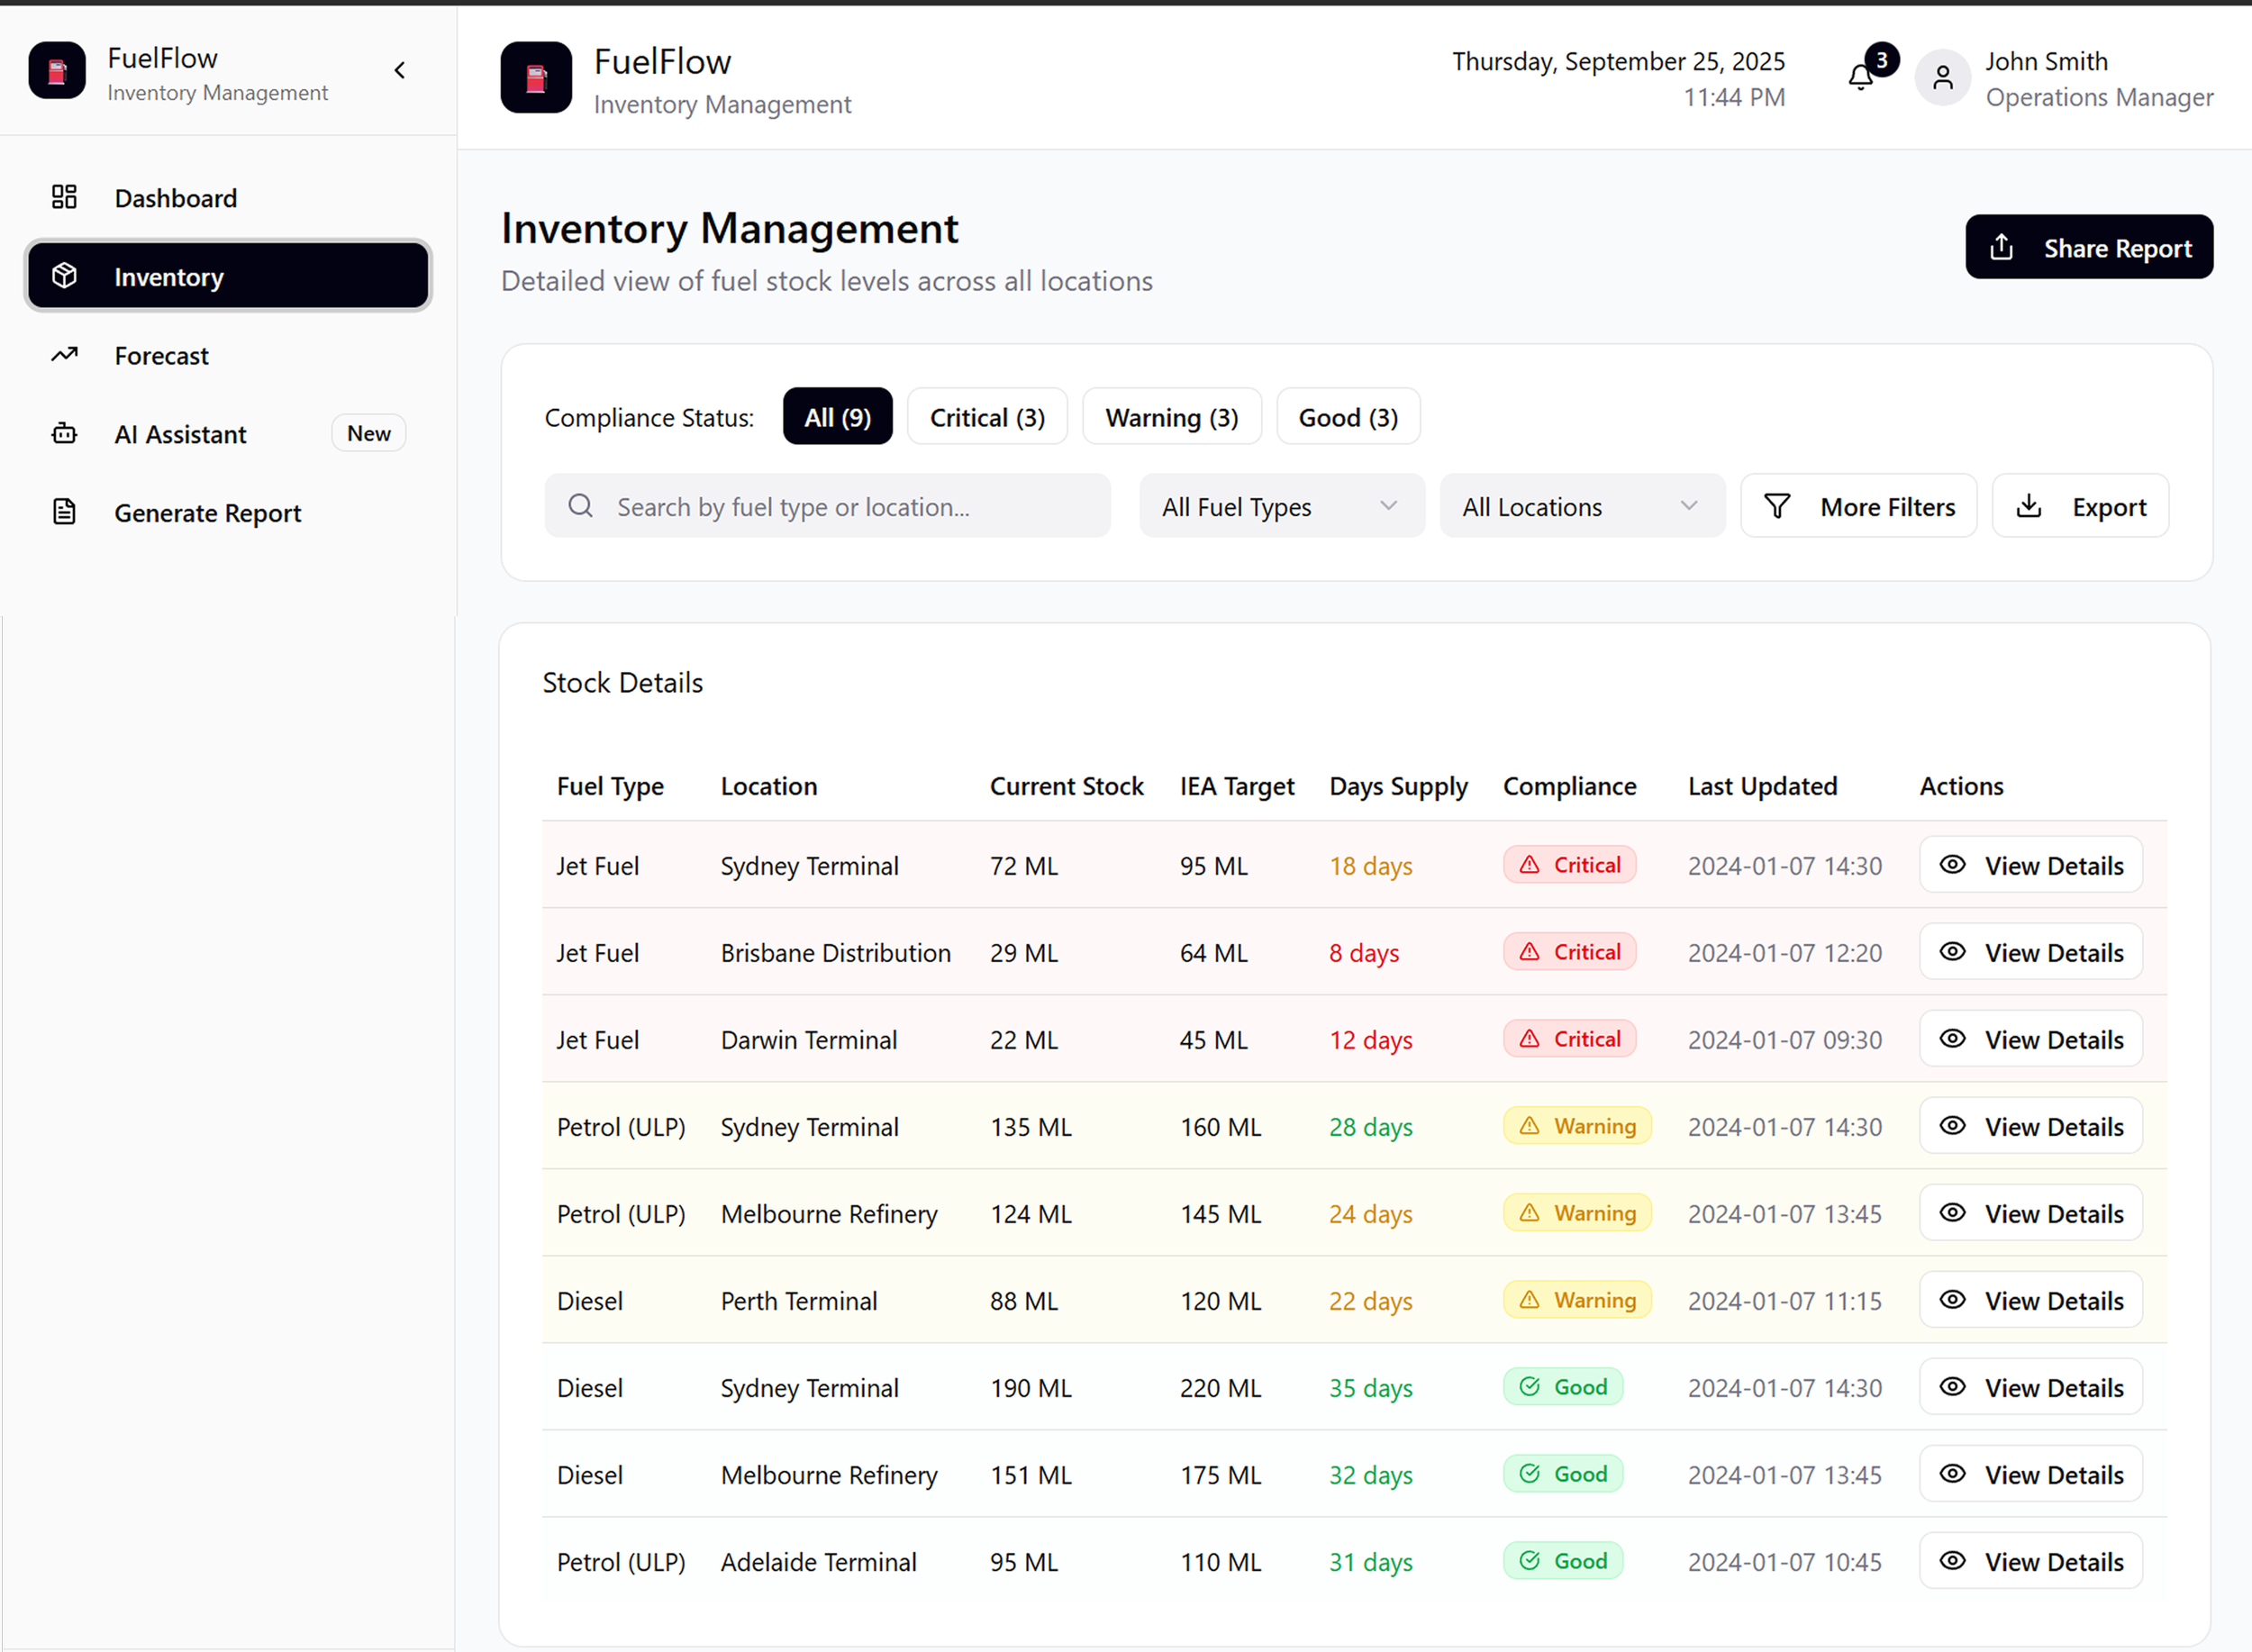
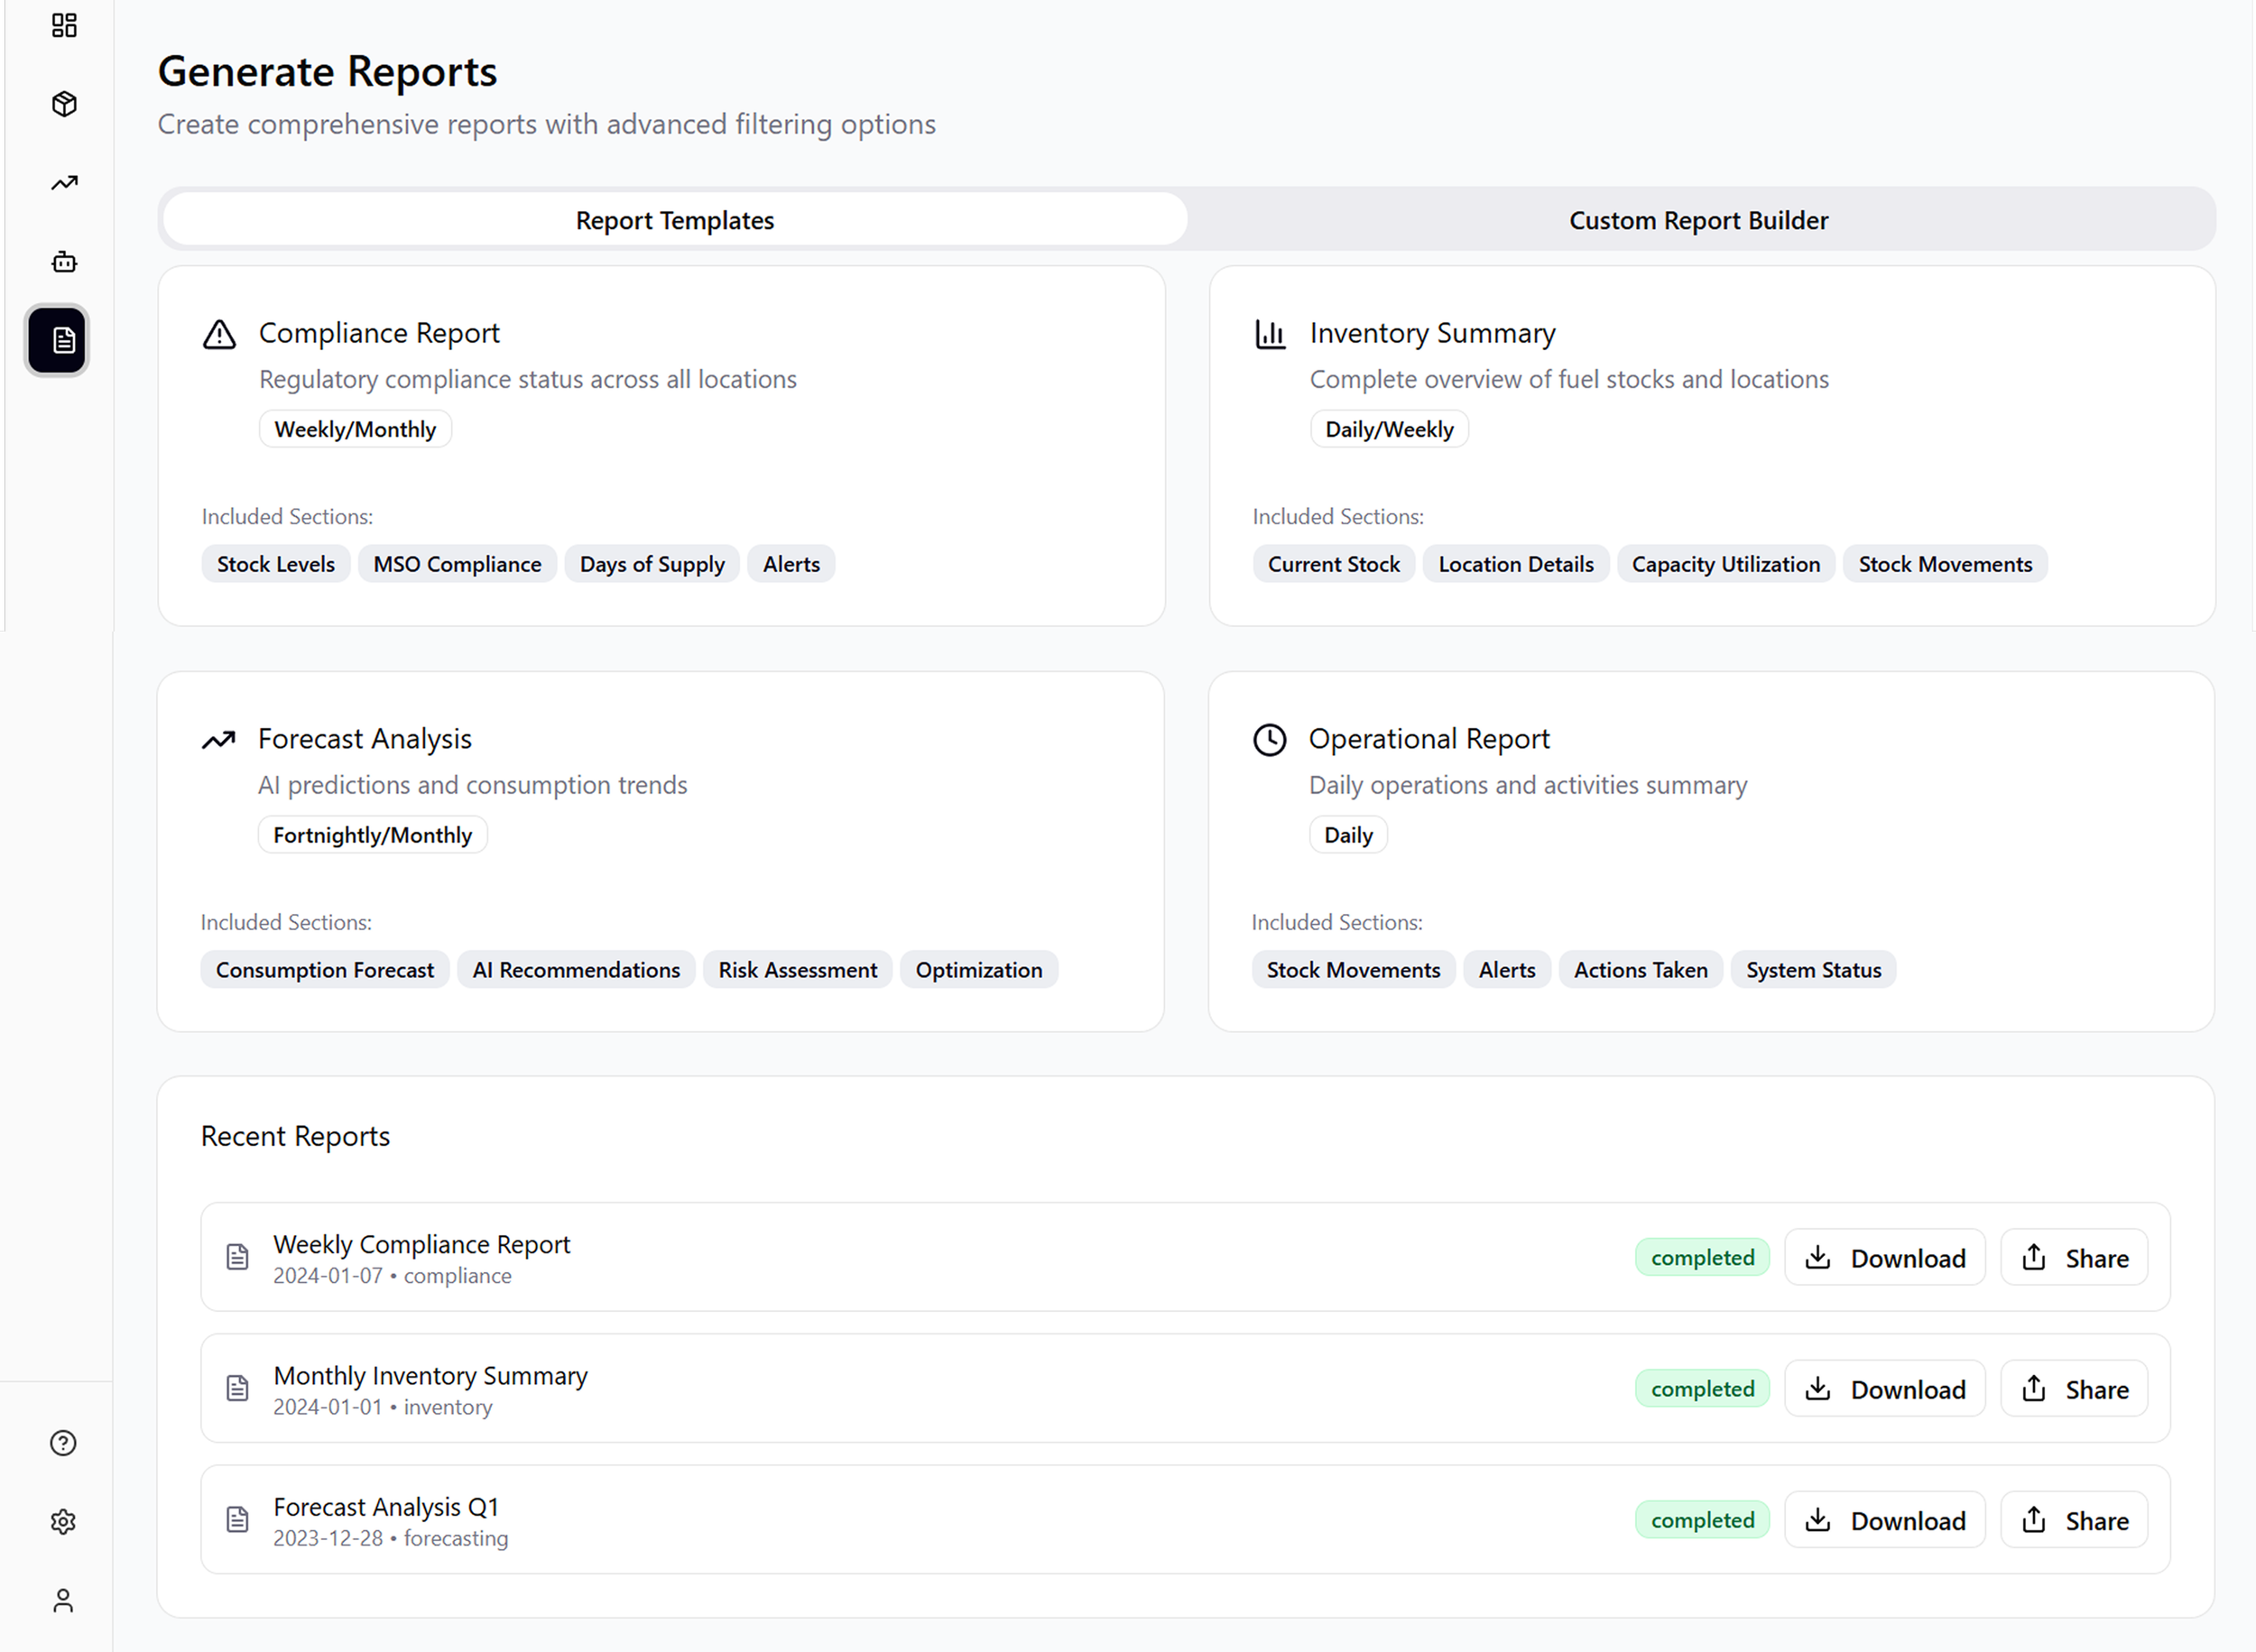
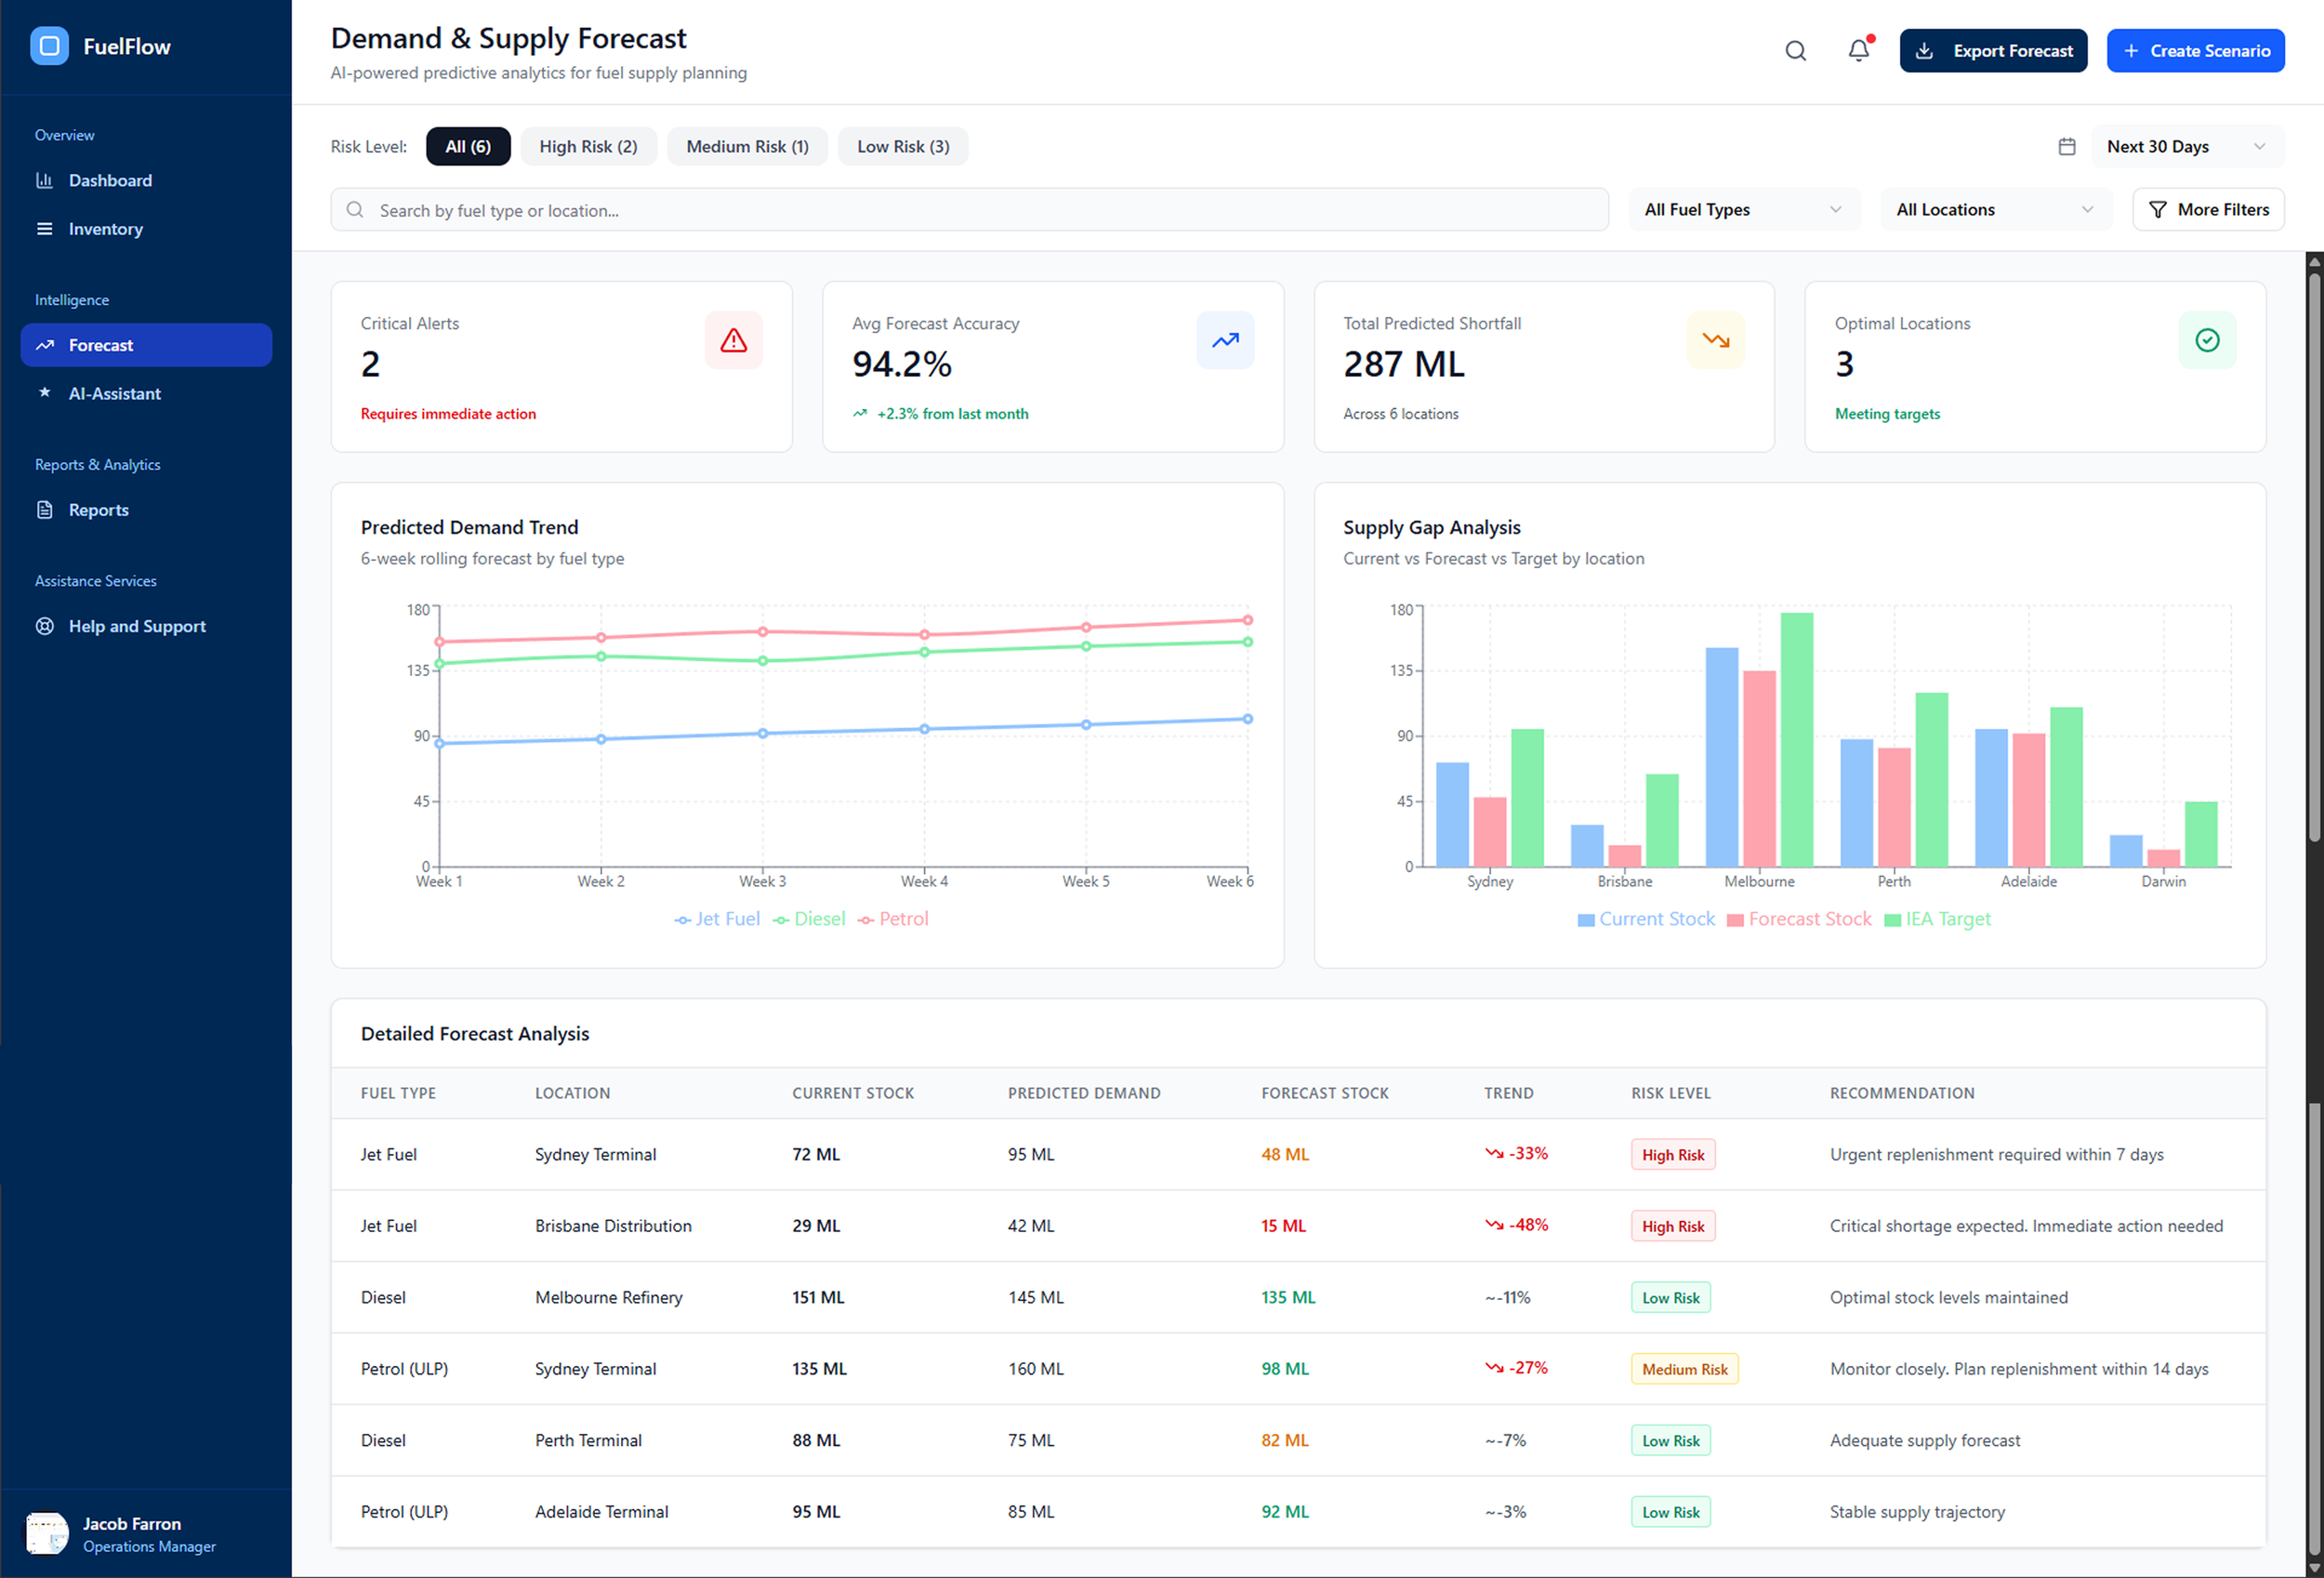
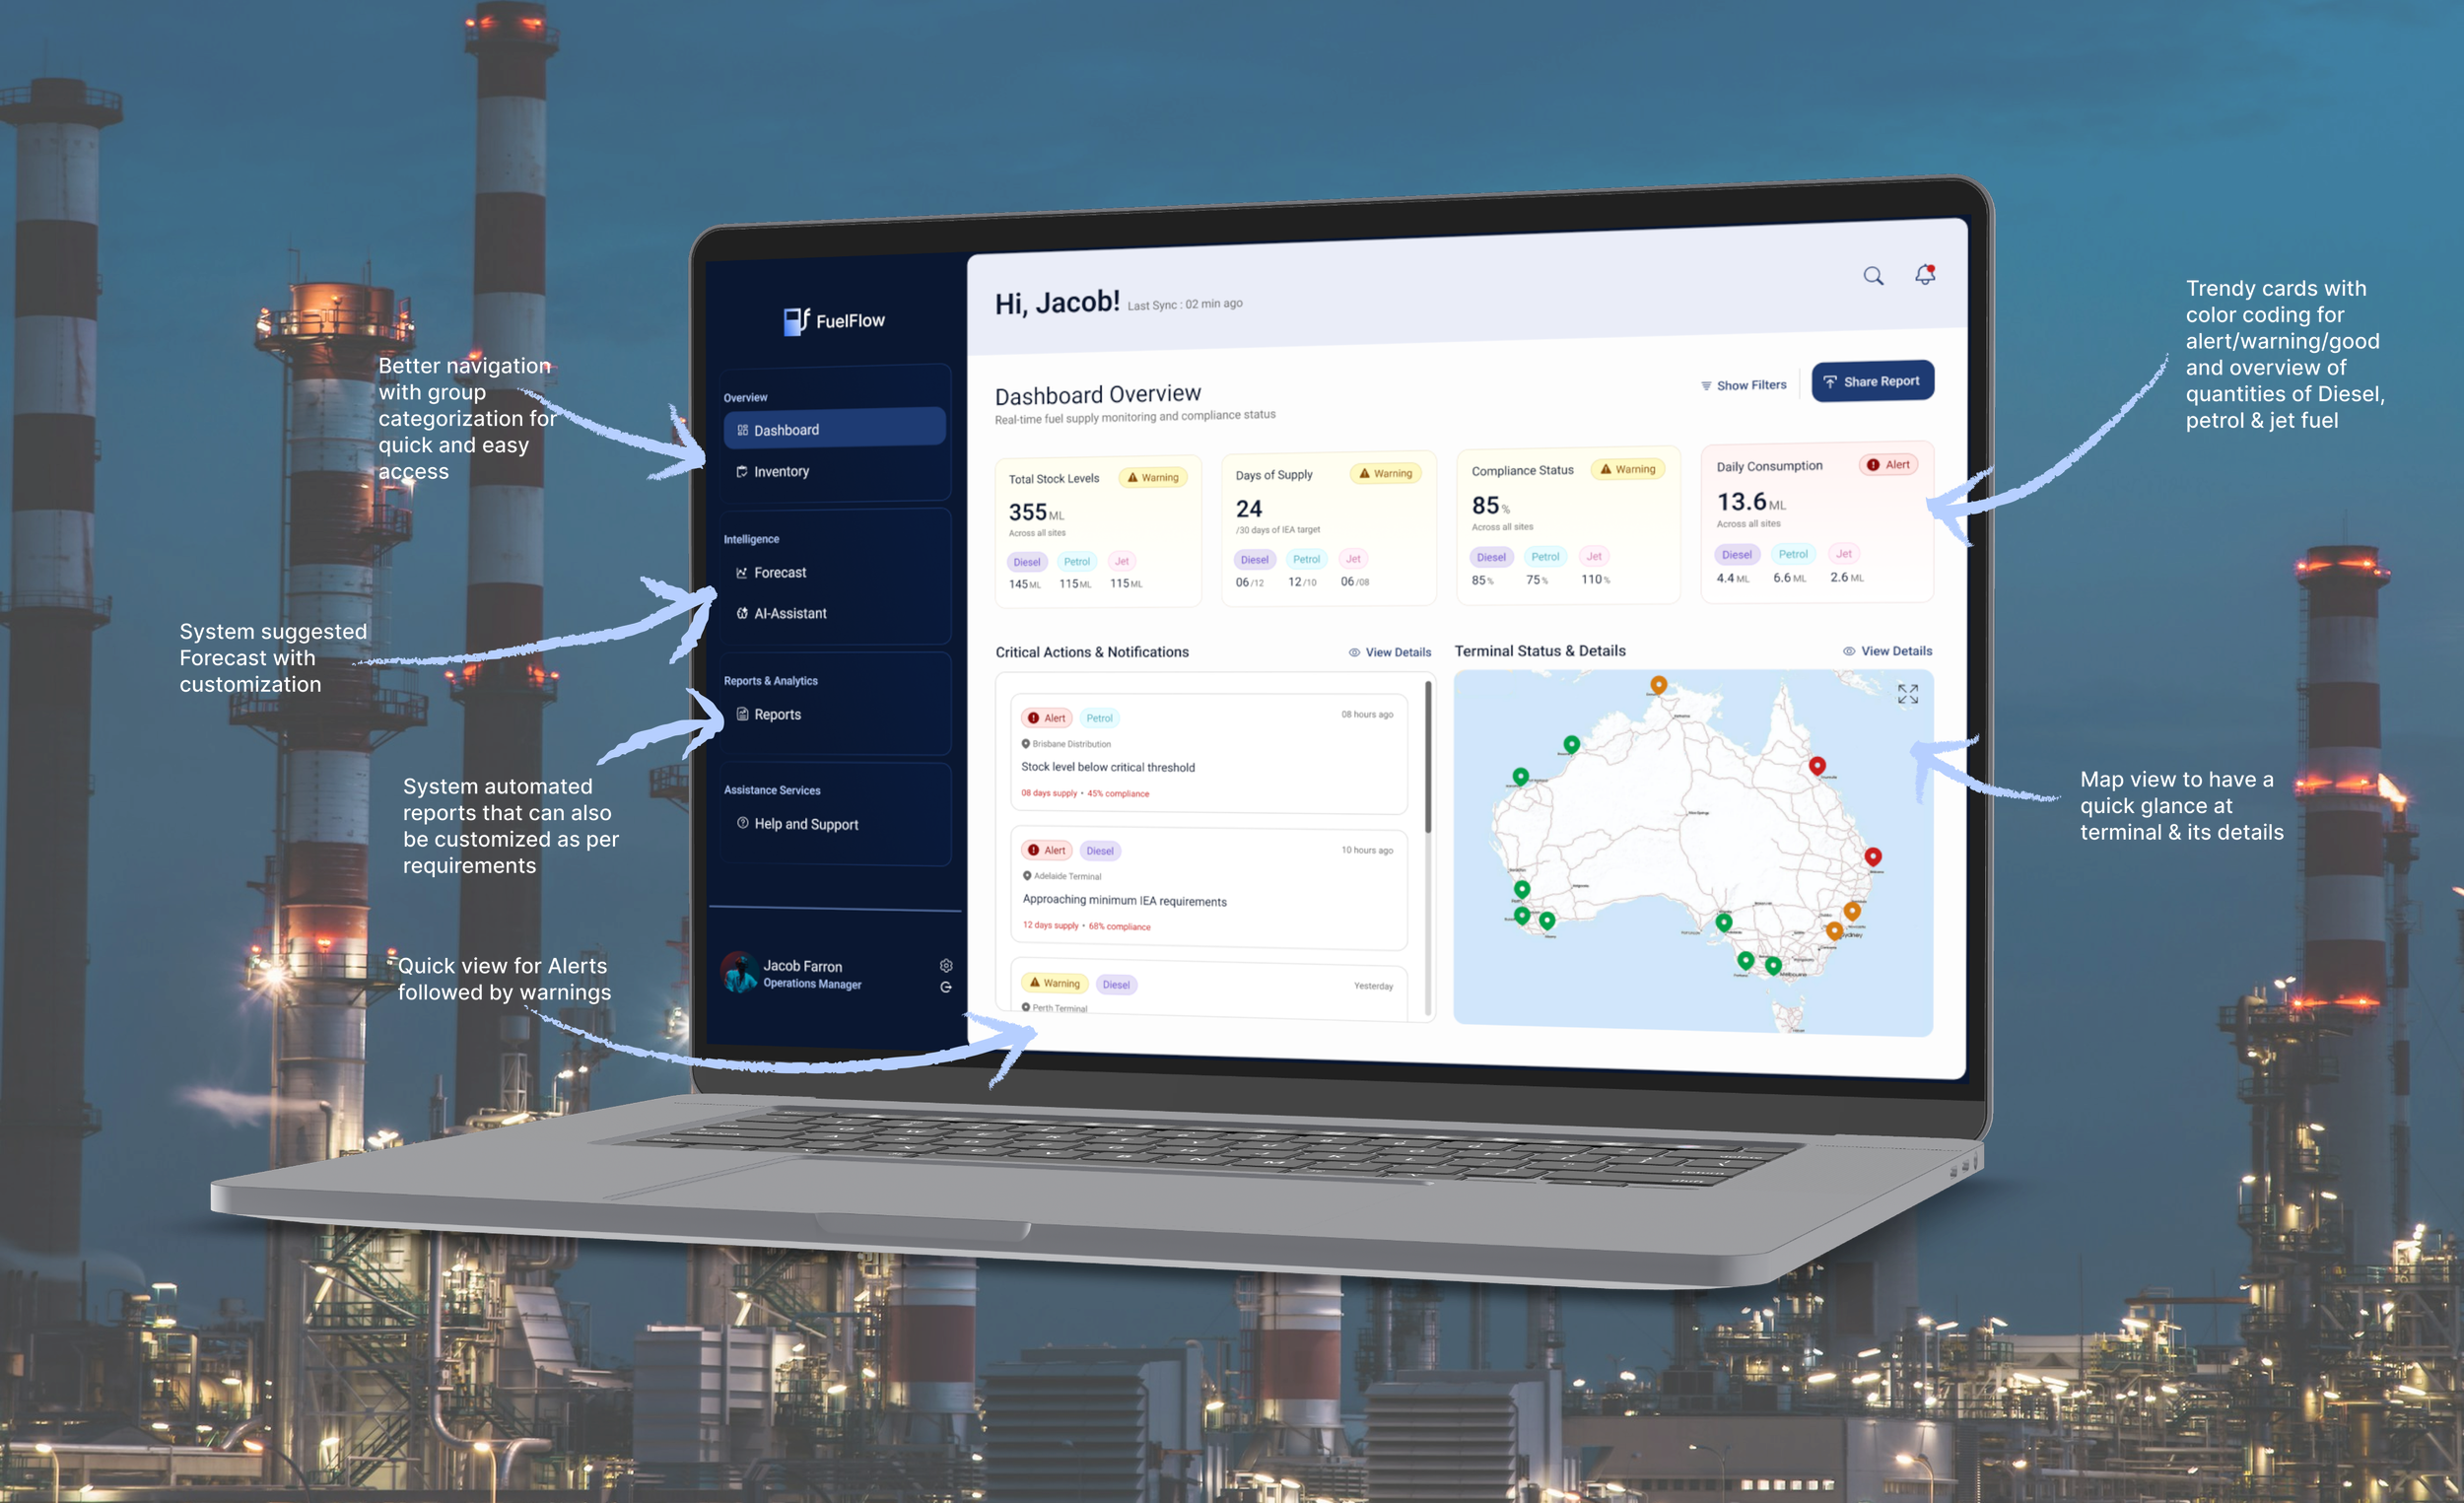
To address this, I designed an intelligent dashboard system that brings everything into one place — delivering real-time visibility, AI-driven demand forecasting, and automated, customizable compliance reporting. The result was a powerful yet intuitive tool that helps the company stay compliant, optimize resources, and maintain a reliable fuel supply at all times.


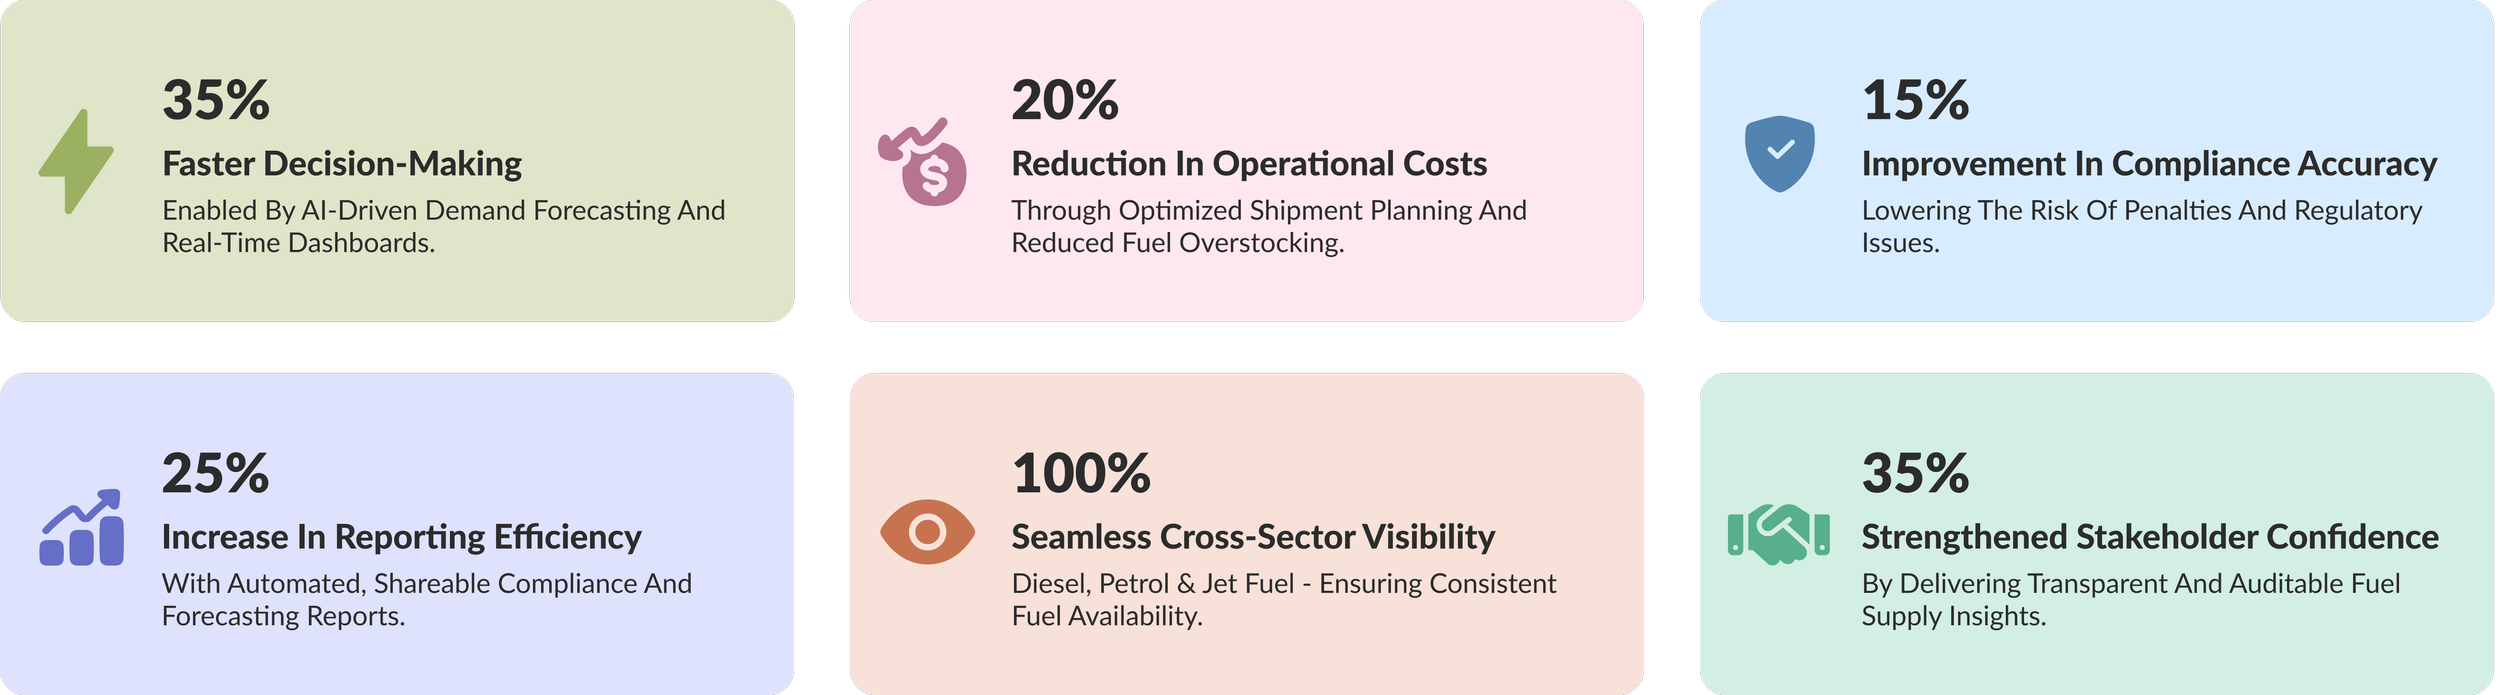
Business Impact
Time
06 Months
In 2025
Agile Methodology
B2B Application
Project Management
Design Process
Define & Ideate
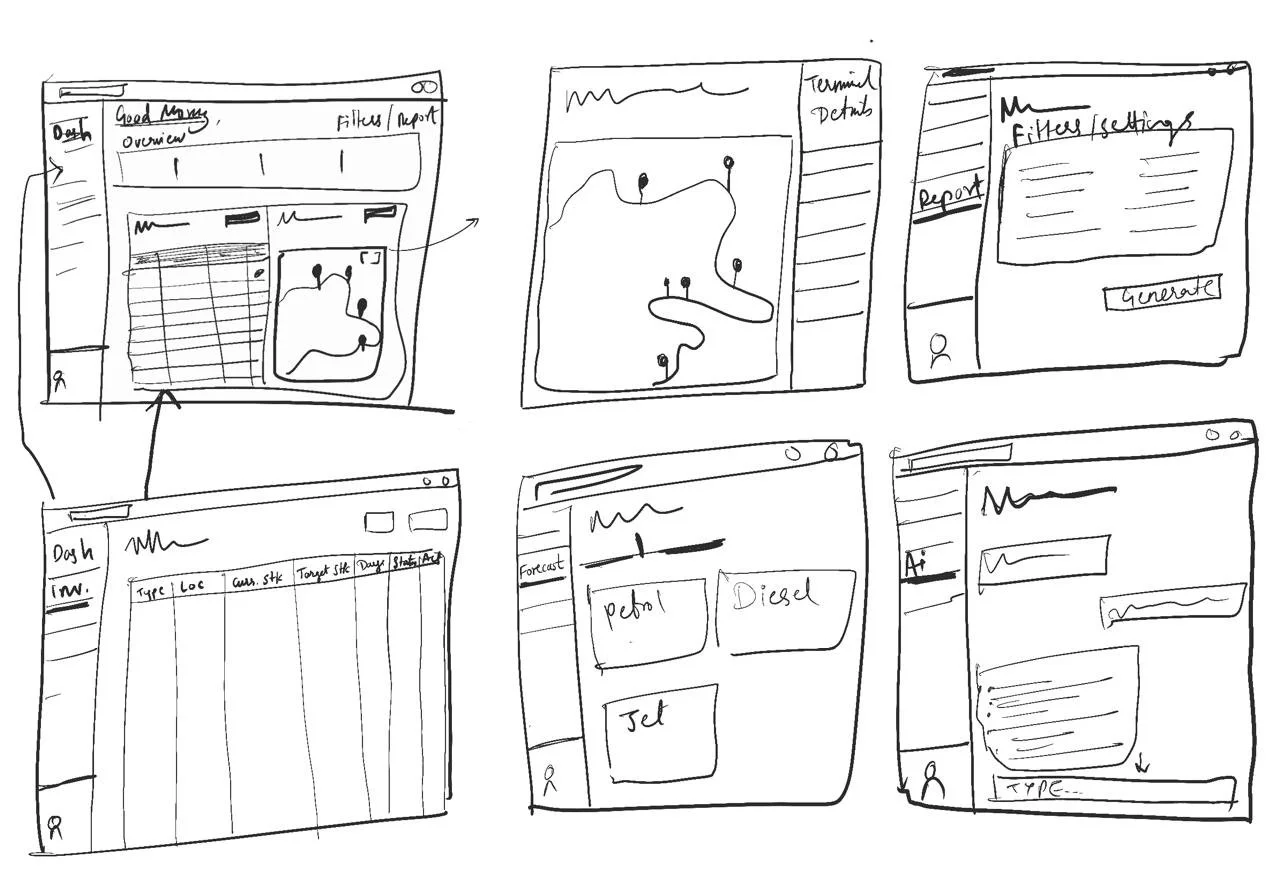
I explored concepts through rapid sketches that evolved into low-fidelity wireframes, allowing ideas to be tested and refined early. These were then translated into high-fidelity wireframes and visual designs, supported by moodboards to establish the right visual language, and finalized through clear visual guidelines to ensure consistency and scalability.
The GO-LIVE marked a major success, backed by glowing client feedback and positive user testimonials.
Some key highlights are below
“Compared to what we used before, this is a game-changer. It saves me time & reduces frustration. Wish we had this earlier!”
“The design feels modern yet simple. I can complete my tasks much faster now.”
“Earlier, everything was fragmented and we had to use 10 things for a correct approach. But with smart use of technology and trendy design, the process feels smooth and enjoyable; indeed a great experience.”
I created interactive prototypes to bring the experience to life and validate flows early. Through iterative peer, internal team, and stakeholder reviews, the design was continuously refined, followed by user testing to validate usability and incorporate improvements before finalization.
Interested to know more? Please contact for the details!
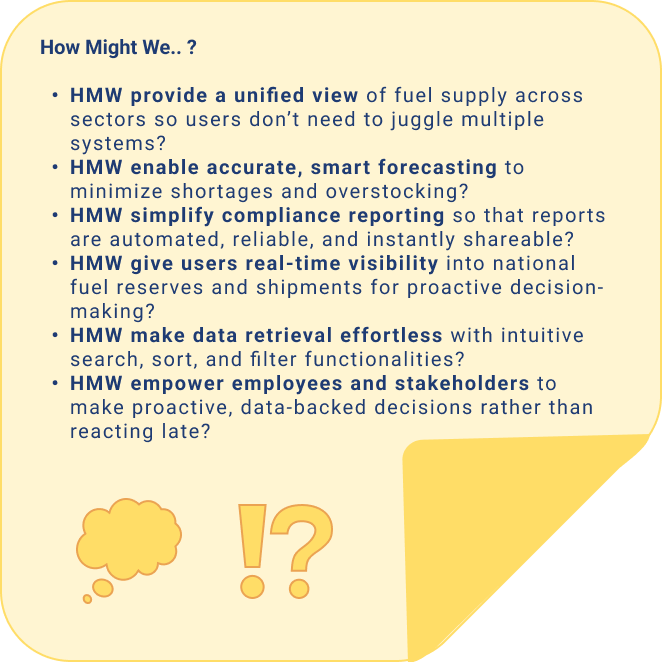
I synthesized research insights to clearly define user needs, frustrations, and underlying motivations. These findings were translated into focused “How Might We” statements, which guided ideation sessions where collaborative brainstorming and interactive activities helped generate and refine meaningful solution directions.
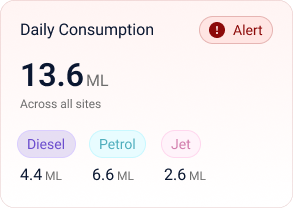
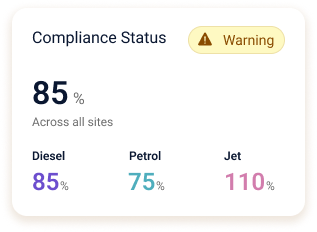
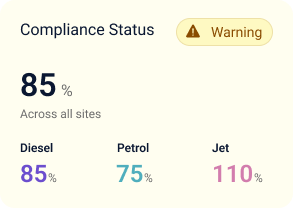
Explored multiple card-based visual design options to clearly surface fuel status across all sites, using visual hierarchy, color semantics, and state indicators to ensure quick recognition and scan ability.
Client Feedback
“Working with Kshitija was an excellent experience. She brought structure and clarity to the UX process, ensuring our business goals were met while keeping the user at the center. The final application not only went live successfully but also received outstanding feedback from our users.”
“With Kshitija’s user-centered UX strategy, the project achieved both business goals and delighted users at launch.”
Personal Learnings
This project challenged me to manage time zone differences and tight schedules, strengthening my adaptability.
Collaborating globally taught me patience and the value of keeping work structured.
Balancing diverse expectations under tight deadlines reinforced importance of agility and helped me deliver innovative yet feasible solutions.
On several occasions, effective communication and people skills had a greater impact than my design abilities.
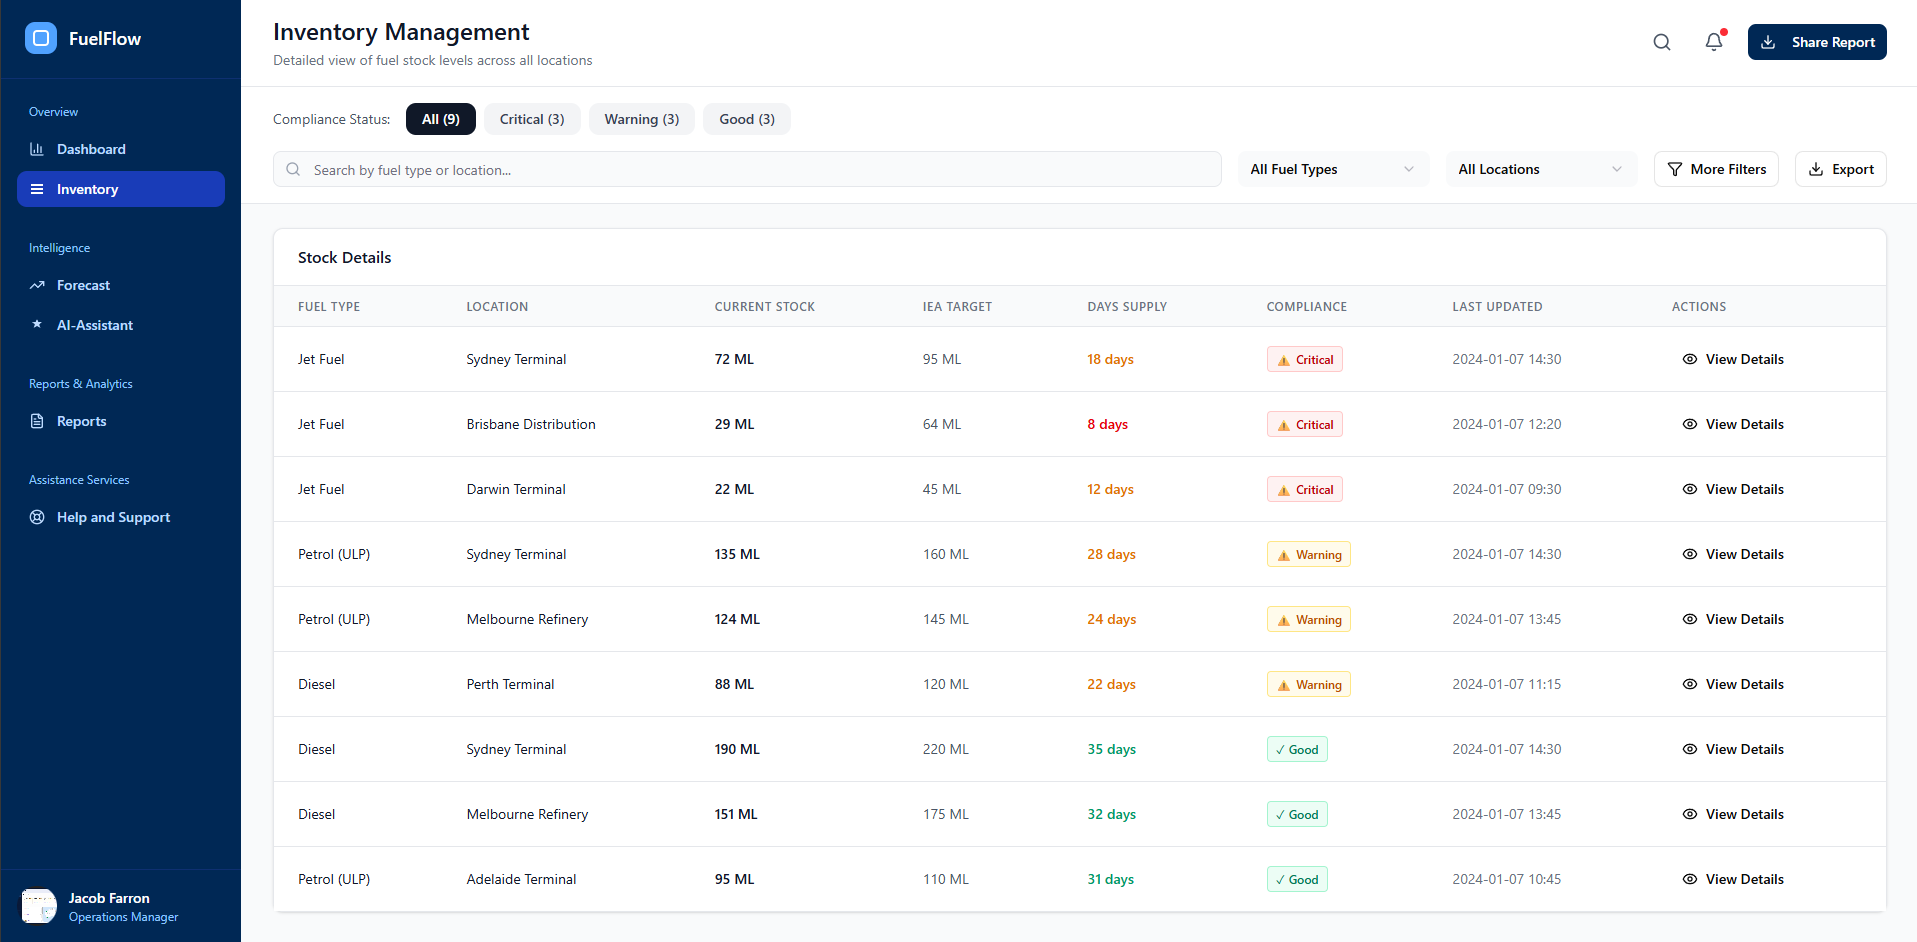
It was a great launch where the design translated complex fuel data into clear, actionable insights, enabling faster and more confident decision-making. It drove operational efficiency, improved compliance reliability, and streamlined reporting while delivering unified visibility across fuel segments—strengthening supply continuity and stakeholder confidence.
Led end-to-end design of the web application, from user research to final prototypes, followed by iterations.
My Game Changer Move - Introduction to Artificial intelligence and automation.
Designed data-heavy interfaces with clear information hierarchy and intuitive interaction patterns.
Created visual design system (colors, typography, iconography, components) aligned with industry, brand and compliance needs.
Collaborated closely with users, product managers, engineers, and stakeholders to align business requirements with user expectations.
Applied UX best practices for dashboards, ensuring clarity, accessibility, and scalability.
Contributed domain expertise in enterprise dashboard design, focusing on trust, usability, and efficiency.
Complex Systems
Data Visualization
B2B
AI